This is a question that I often get from SEO clients. It is often difficult to pin down the exact reason why this is happening. The phenomenon of impressions going up but the average ranking drops seems very counter-intuitive. One would think if your site is getting more impressions it is because of better ranking. This is not always the case.
Case 1: Rank Improves and Impressions Improve.
This one is easy to understand. I a page goes from number 15 to number 7 in the SERPs, then it makes sense that searchers would see it more often which means more impressions.
Impressions vs Rank
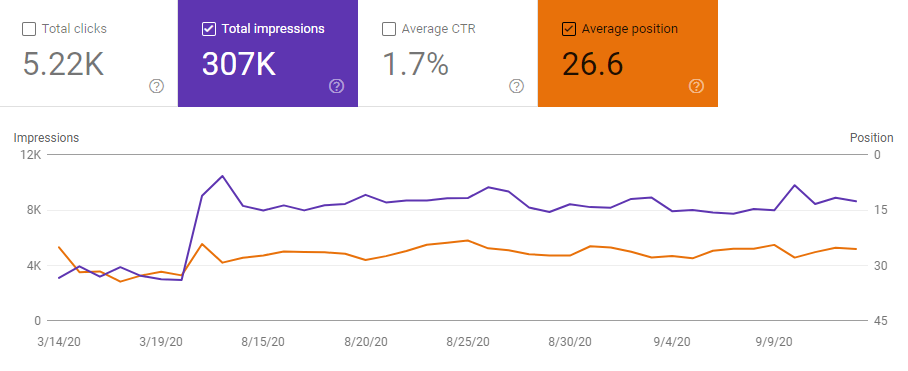
And conversely, a drop from position 7 to position 15 would mean fewer people see the page. You can see this in the trend below.
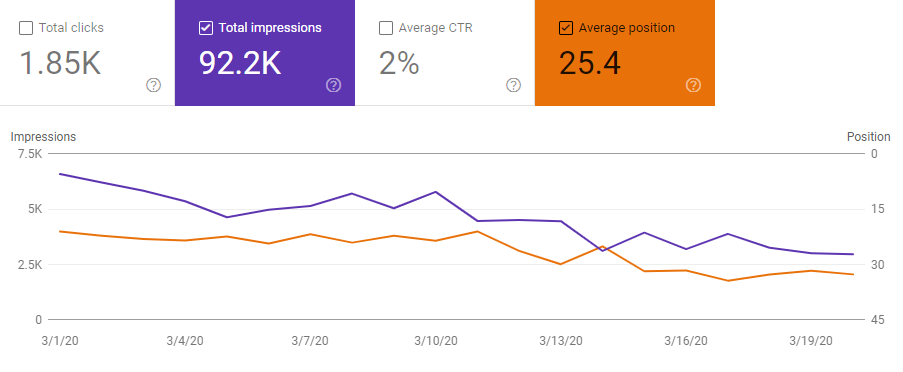
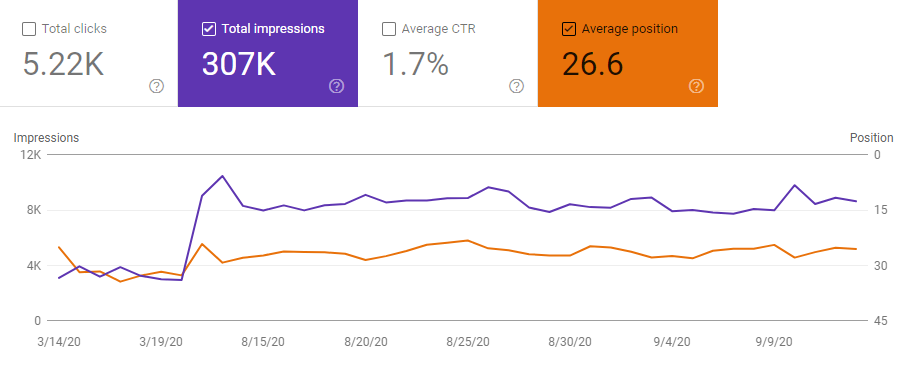
Something that you need to take note of, even in this simple version. The change doesn’t often happen on the same day. For example when both increase it is common to see the increase in page rank appear before the increase in visibility. In the chart below you’ll see the peak after 3/19/20 and then the peak in impressions lags a day or two behind. See the blue arrows below. The same thing happens when the numbers go down. Still relatively straight forward though.
Case 2: Impressions Go Up But Rank Goes Down
This is where it gets a bit weird. We’ll look at a different graph for this one. If you look at the graph below you’ll see in orange (Average Position) what looks like a mirror image of the graph line in purple (Total Impressions). The troughs in the orange data match up with the spikes in the purple data.
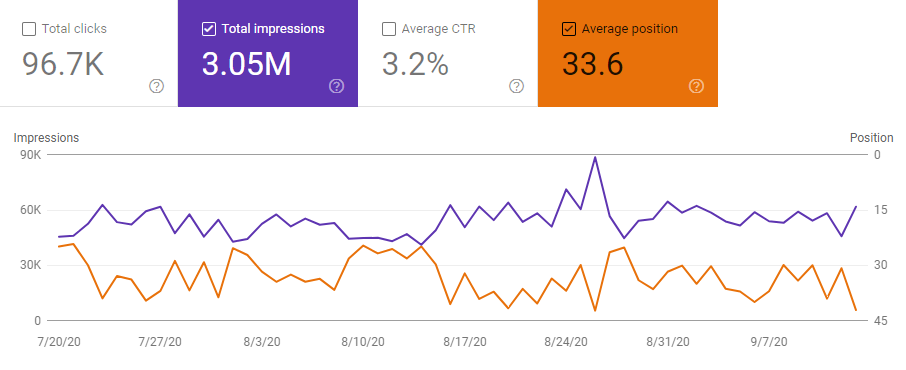
So, let’s unpack this. As I mentioned earlier this seems very counter-intuitive. There does not seem to be a very noticeable lag in this case, so it’s not clear what the cause of the fluctuations. With a lag like in the previous diagram, we could see that the on metric was driving the change in the other. Let’s take a look at the other data you can get from Google Search Console.
Clicks vs. Impressions
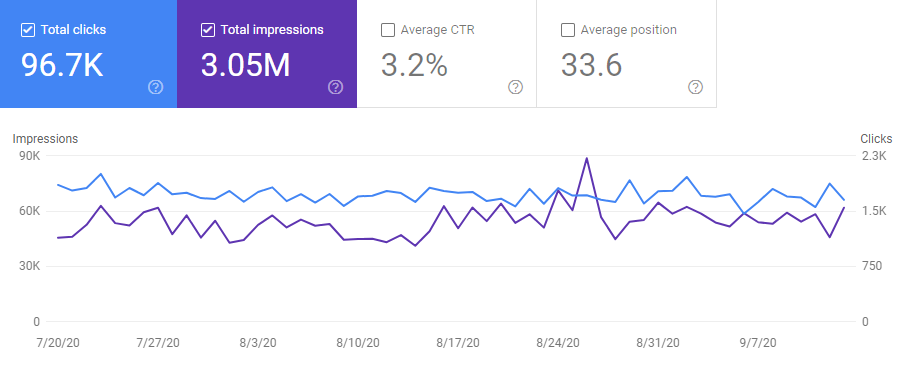
This data shows a relatively consistent trend for Total Clicks (in blue). There is some fluctuation but nothing like the position or impressions. It appears in this time period there were between 1.5K and 2.0K clicks, regardless of the number of searchers that were exposed to the content. So unlike the first case, it doesn’t appear that there is a direct correlation between the number of impressions and clicks.
The last metric we can pull from GSC is Average CTR (Impressions vs CTR):
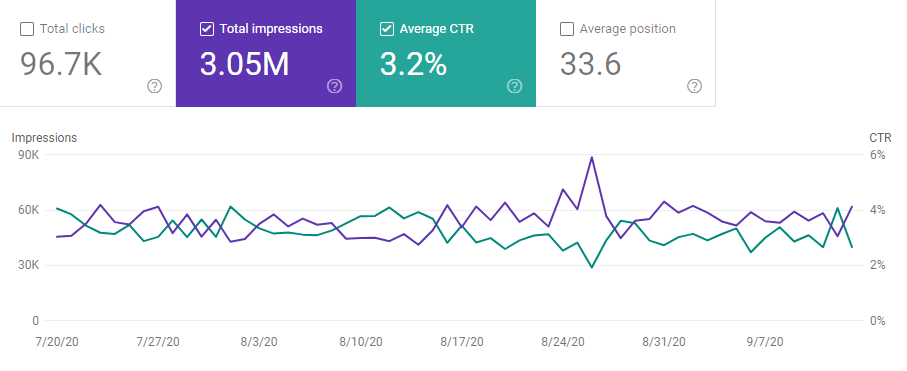
You should notice that this graph also looks like a mirror image. The way the graphs are laid out they flip flop. When impressions go up Average CTR goes down. So it appears to have an inverse correlation. Click-Through Rate is defined by the ration of the searcher who clicks on a link in the SERPS compared to the number of people that saw the page (Impressions).
Clicks / Impressions = Click Through Rate
If we take a step back and add the Total Clicks graph, you can start to see that in this case, the Total Clicks is so consistent the Impressions are driving the AVG CTR. Meaning when Impressions fluctuates so does the AVG CTR.
Impressions, Clicks, CTR
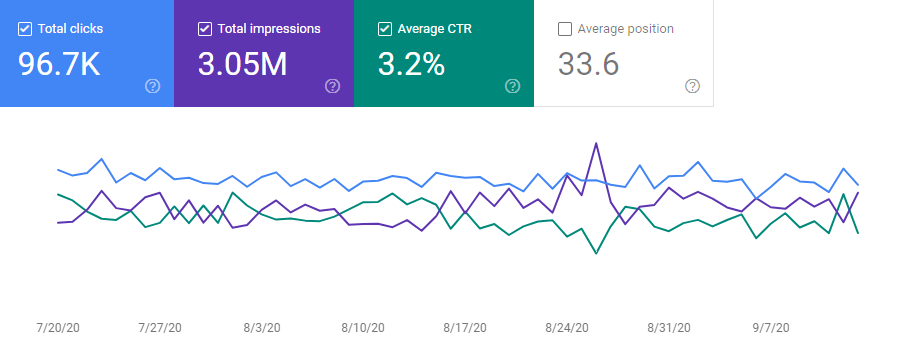
So what does it all mean? We still haven’t answered the question.
Take a look at the last graph with all 4 metrics at once we get a fuller picture of what’s happening.
Impressions, Clicks, CTR, Average Position
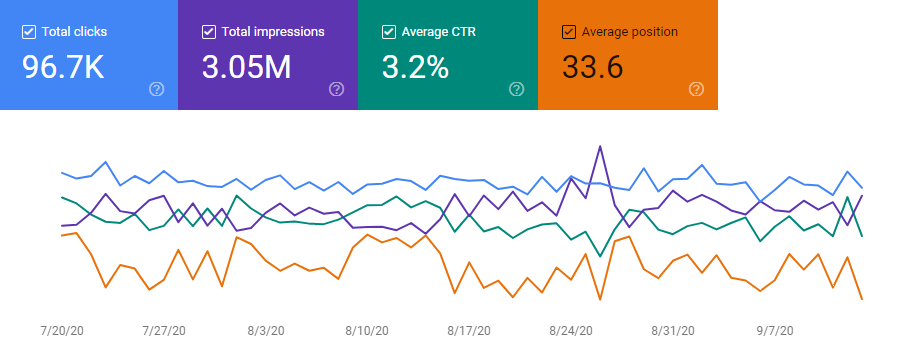
The question is what would cause clicks to do down and impressions to go up?
In the first case, we saw a correlation where more impressions meant more clicks. This example does not appear to follow a 1 to 1 relationship, it seems to be the inverse.
Conclusion
What Google is really looking at is the Click Through Rate. If the click-through rate goes up the then the rank will increase. If for some reason, there is a spike in Impressions, but the number of clicks doesn’t change. The CTR will go down, as well as the Average Position.
Clicks / Impressions = Click Through Rate
100/1,000 = 10% CTR
If Impressions see a spike.
100/2,000 = 5% CTR
If Impressions go down and Clicks are consistent.
100/500 = 20% CTR
The graph below shows how this looks in real life.
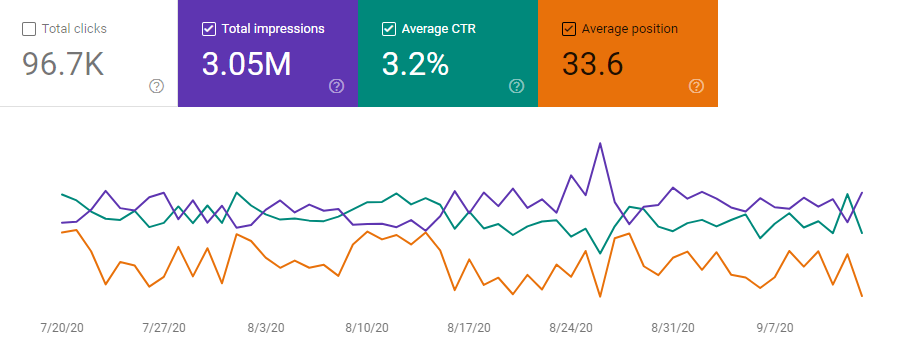
Basically that means the most important metric that you can track in Google Search Console is the Click Through Rate. Later we will discuss ways to improve your CTR.

